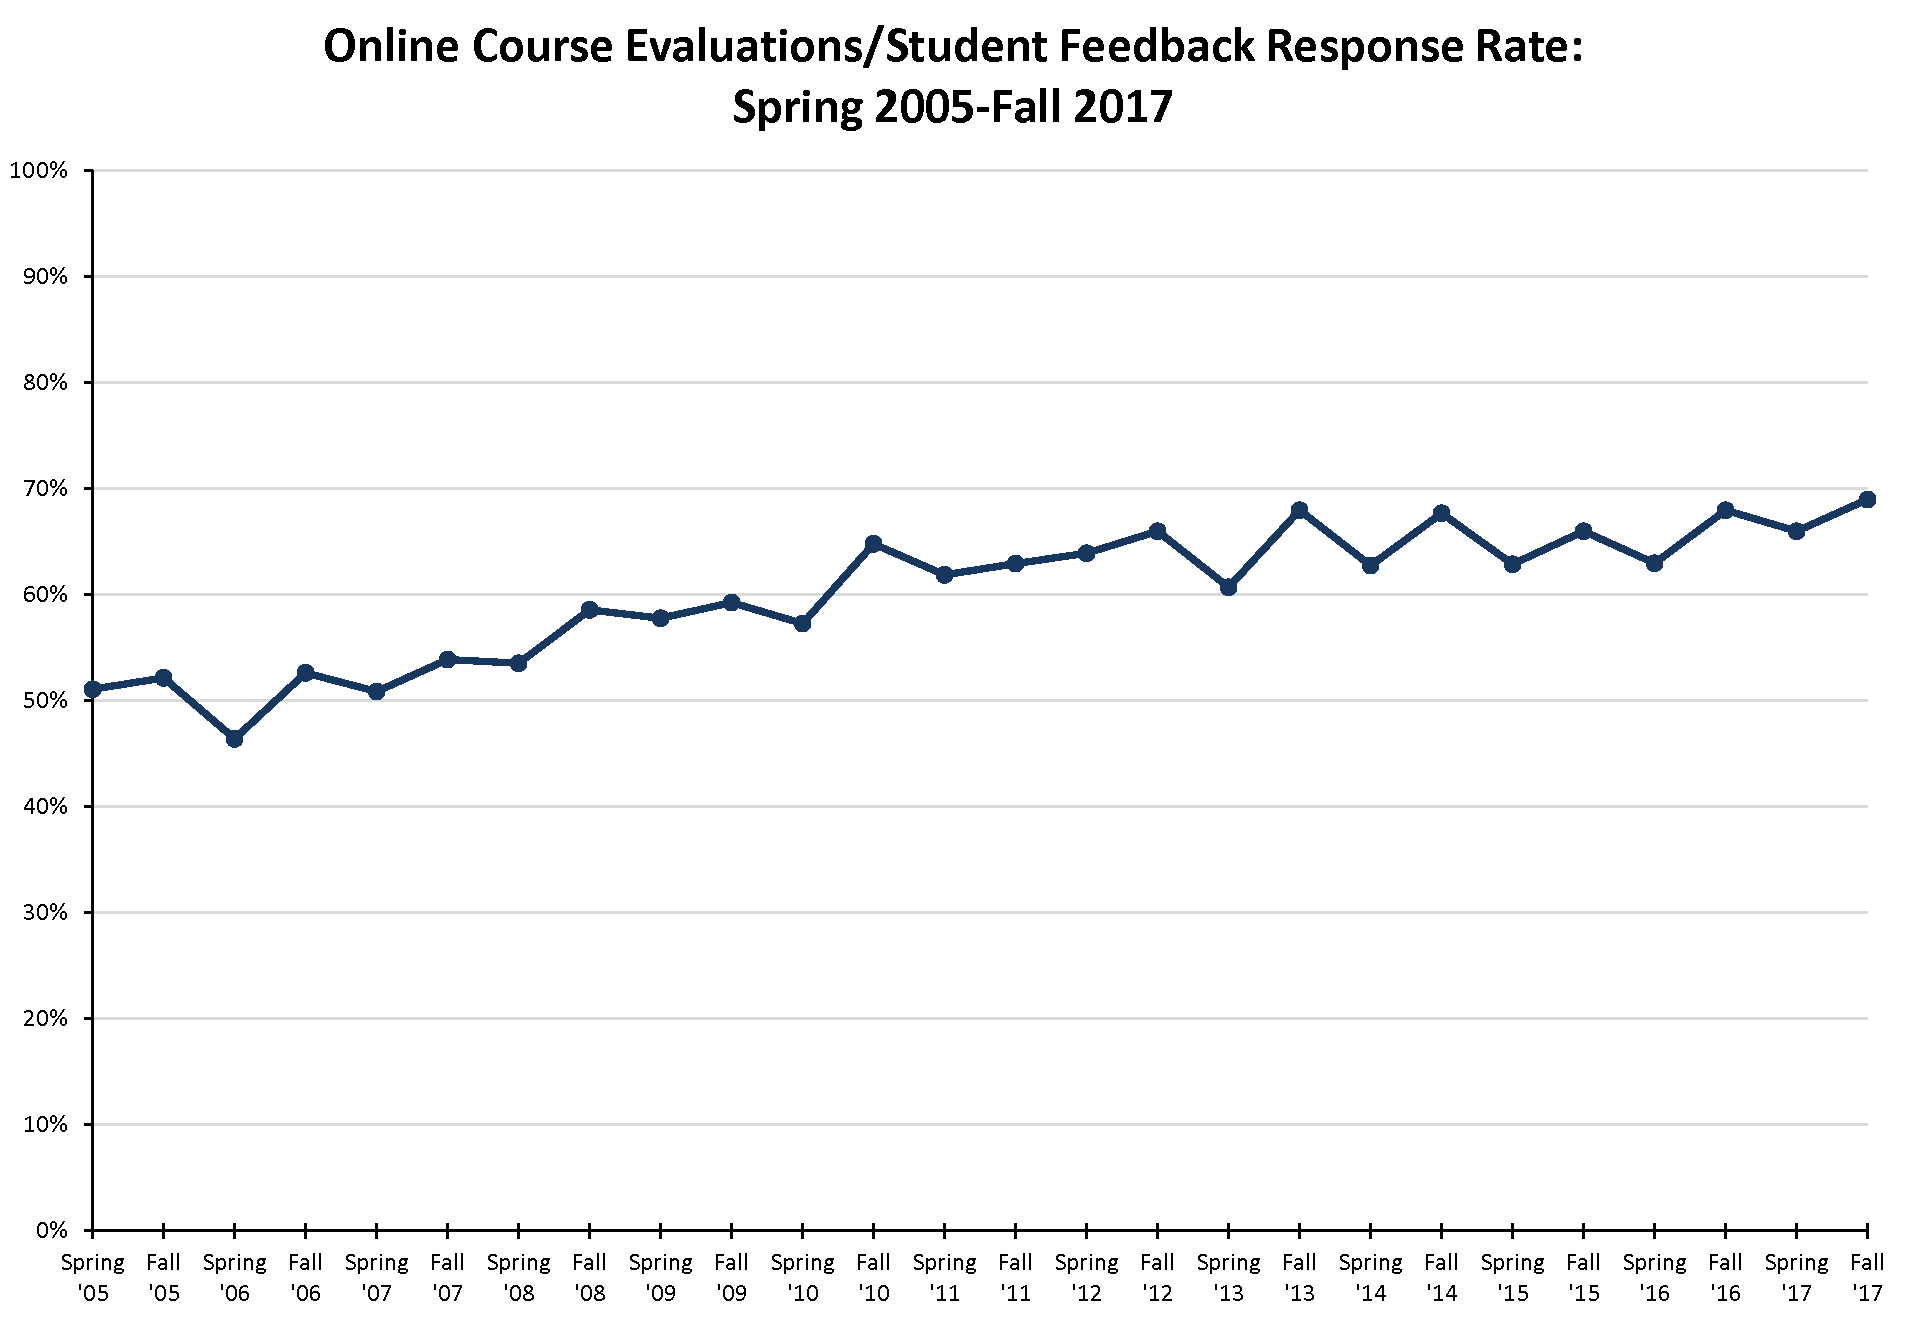
Response Rate Trend
Below is a graph of the response rate for online course evaluations from Spring 2005 to Fall 2017 for the George Washington University.
Note: We switched from the Online Course Evaluation system to the Student Feedback system in Fall 2015.
Click on the image for a full-size version of the graph.